
An example brief for ten industrial listings
The example brief covers ten listings in New York and Connecticut, with a closer look at the Port of Albany.
At the Port of Albany
| What the utility's file says | What the research finds | Question for the utility |
|---|---|---|
| National Grid’s February file lists 63.8 MW of headroom at Trinity TB 6, near the Smith Boulevard site. | In the files, February’s peak is zero, so the headroom equals the bank’s full rating. March shows a positive peak and 39.1 MW of headroom. The files do not explain the zero peak or why the peak entries differ. | What does a zero peak mean, and does this bank serve the site? |
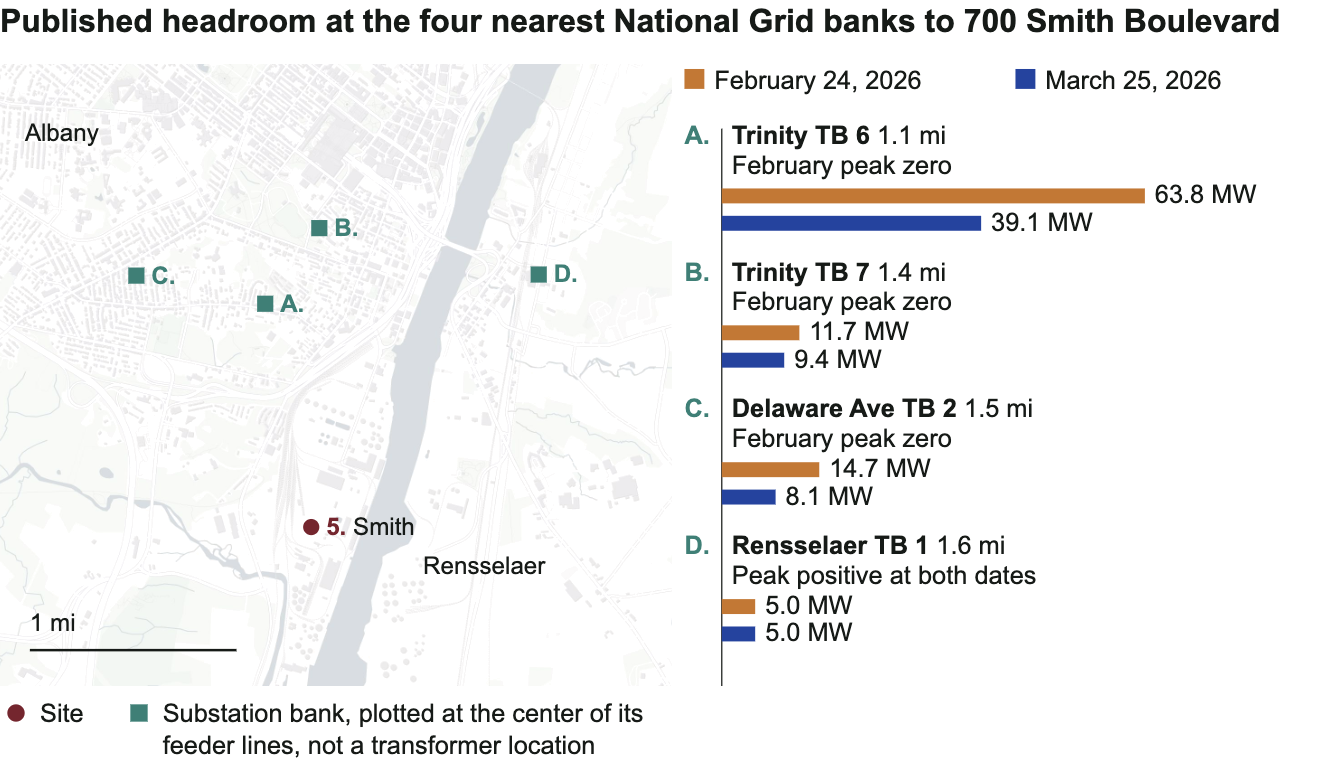
The utility still needs to confirm which equipment serves the property.
What you’ll receive
The brief gives developers, brokers, consultants and investors findings and utility questions for up to ten properties.
What does the utility data show? The latest published figures near each site, what they measure, and the basis for relating the records to the property.
What needs a closer look? Older readings where the records contain them, gaps in coverage, and figures that need interpretation before you use them to assess a site. Differences between utilities’ metrics are explained alongside the figures.
What should you ask the utility? Questions specific to each property, including which equipment supplies it and what the published figures mean for your proposed use.
Source links and utility-reported dates accompany the figures; missing dates are identified.
Working with the available information
Coverage varies by utility and currently includes parts of California, Connecticut, Delaware, the District of Columbia, Maine, Maryland, New Jersey, New York and Rhode Island. Every figure keeps the date its source file gives; where there is none, the brief says so. Utility confirmation is needed for serving equipment, connection route and project requirements. See data quality and corrections.
The data and tools behind the brief
Each week, data pipelines check sources from more than a dozen utilities in nine states and keep every original file. They save a new reading only when a figure changes, with the source's date attached.
The normalization layer puts the utilities' different file formats into a common record structure, preserving each figure's unit, date and metric. Load-serving headroom, EV hosting capacity and electrification headroom stay separate.
The brief draws on this database. You can also explore it with the tools below.
Site search shows nearby substations and feeders for a location, with the metric, unit and source date.
Batch screening does the same for a list of sites.
The API returns feeder and substation capacity as JSON, with metric classifications and source dates.
Demand scenarios compares an added load with the figures where they are comparable. It is an arithmetic reading, not an assessment of a connection.
Demos are available on request.
Get in touch!
These tools are developed by Ash Wang, a former researcher at BloombergNEF.
Send your list of addresses to [email protected].